Solar Energy vs Traditional Power: The Economic Tipping Point Has Arrived
DLXN Energy Editorial Team·
Green Energy for a Low-carbon Tomorrow
Click to skip
---
Since 2009, the global weighted-average LCOE for utility-scale solar PV has dropped from $359/MWh to just $38/MWh in 2023, according to the International Renewable Energy Agency (IRENA). That represents a 90% reduction in fourteen years—a cost decline that no other electricity generation technology has matched in modern history. For context, the same IRENA dataset shows onshore wind fell 69% over the same period, while natural gas combined-cycle plants have remained flat at approximately $60–$80/MWh depending on regional fuel prices.
The implications extend beyond simple price comparisons. According to BloombergNEF's 2023 Power Transition Trends report, solar now undercuts both coal and natural gas on an unsubsidized basis in countries representing 96% of global GDP. This is not a marginal advantage—it is a structural shift. In Texas, where deregulated electricity markets reward the lowest-cost producer, solar generation grew from 1.4 TWh in 2015 to over 31 TWh in 2023, according to the U.S. Energy Information Administration. Traditional generators are no longer competing on technology; they are competing on price against a resource with zero fuel costs.
When comparing solar versus traditional energy, the apparent cost advantage of existing coal and gas plants often ignores externalized costs. The National Renewable Energy Laboratory (NREL) published an analysis in 2022 quantifying the health and environmental damages associated with fossil fuel electricity generation at $74.6 billion annually in the United States alone. These damages—respiratory illness, premature mortality, crop damage, and climate-related losses—are not reflected in utility bills but are paid through healthcare systems, insurance premiums, and disaster recovery budgets.
Traditional thermal plants also carry dispatch constraints that solar does not. Coal plants require 4–8 hours of startup time from cold shutdown, according to the U.S. Department of Energy's 2023 thermal plant flexibility assessment. Natural gas combined-cycle units are faster, requiring 30–60 minutes, but still cannot match the sub-second response of inverter-based solar resources. This operational rigidity becomes increasingly problematic as grid operators demand faster ramping capability to balance variable renewable output.
The most substantive technical criticism of solar energy has always been intermittency. The sun does not shine at night, and cloud cover can reduce output by 70–90% in minutes, according to NREL's Solar Power Forecasting research. However, the rapid deployment of battery storage is resolving this constraint. Global energy storage installations reached 45 GW in 2023, up from just 3 GW in 2019, per BloombergNEF's Energy Storage Outlook.
The economics of pairing solar with storage have crossed a critical threshold. According to the U.S. Energy Information Administration's 2023 Levelized Costs report, solar plus four-hour battery storage now achieves an LCOE of $72/MWh, which is competitive with new natural gas peaker plants at $85–$110/MWh. This is the metric that matters for grid reliability—not the standalone cost of solar, but the cost of firm, dispatchable solar power.
For residential and commercial customers, the storage equation is even more favorable. DLXN lithium battery systems now provide round-trip efficiency above 92%, meaning that for every 100 kWh of solar energy stored, 92 kWh is recoverable. This efficiency, combined with falling battery prices from $1,200/kWh in 2010 to $139/kWh in 2023 (BloombergNEF), makes solar-plus-storage economically rational for most commercial applications.
Despite the economic advantage, solar faces structural barriers in legacy electricity markets. Traditional capacity markets were designed around large, centralized, dispatchable generators. Solar's output profile—predictable but not dispatchable without storage—does not fit neatly into these frameworks. The Federal Energy Regulatory Commission (FERC) has addressed some of these issues through Order 2023, which streamlines interconnection queues, and Order 2222, which requires grid operators to allow distributed energy resources to participate in wholesale markets.
However, significant work remains. The Lawrence Berkeley National Laboratory reported in its 2023 Utility-Scale Solar report that the average interconnection queue wait time for new solar projects in the United States is now 4.7 years—longer than the construction time for the project itself. This administrative bottleneck is creating a "solar pipeline paradox": record numbers of projects are proposed, yet fewer are actually being completed. The United States added 33 GW of new solar capacity in 2023, but this is still below the trajectory needed to meet national decarbonization targets.
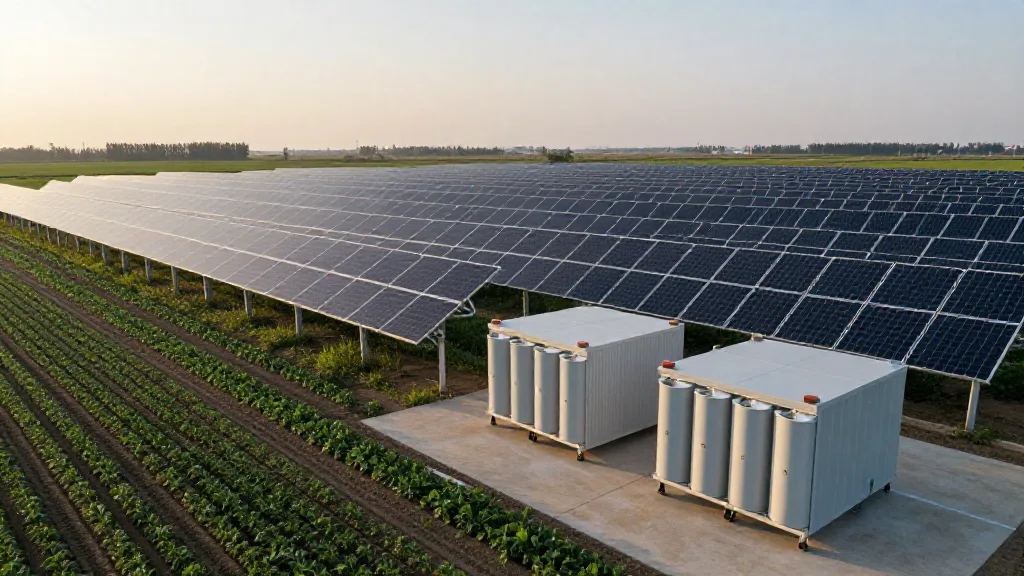
One of the traditional arguments against solar has been land-use intensity. Utility-scale solar requires approximately 5–8 acres per MW of capacity, according to NREL's Land-Use Requirements for Solar Power Plants study. This is significantly more than natural gas facilities, which require 1–2 acres per MW including buffer zones. However, innovative tracking systems are improving this metric. DLXN's solar sunflower tracker uses dual-axis tracking to increase energy yield by 25–35% versus fixed-tilt installations, effectively reducing the land required per MWh generated.
This matters because land scarcity is increasingly the binding constraint for solar development in densely populated regions. The National Renewable Energy Laboratory estimates that meeting U.S. electricity demand with solar alone would require approximately 0.5% of total U.S. land area—a significant but not prohibitive amount. When combined with dual-use strategies such as agrivoltaics (solar plus crop production), the land-use argument loses much of its force.
For electric utilities, the transition from traditional generation to solar represents both a threat and an opportunity. The Edison Electric Institute reported that utility capital expenditures for solar and storage reached $92 billion in 2023, exceeding investments in natural gas for the first time. However, this transition requires careful management of stranded asset risk. The Institute for Energy Economics and Financial Analysis (IEEFA) estimates that up to 40% of U.S. coal generation capacity could become uneconomic by 2030, representing potential stranded investments of $80–$100 billion.
The forward-looking utility strategy is increasingly hybrid: solar generation paired with C&I energy storage for commercial customers and residential ESS for distributed generation. This approach preserves utility revenue through rate structures while capturing the operational benefits of distributed generation. The International Energy Agency's 2023 World Energy Outlook projects that solar will account for 62% of global electricity generation capacity additions through 2030, with storage growing at a compound annual rate of 28%.
The question of solar versus traditional energy is increasingly moot in economic terms. The International Energy Agency's Net Zero by 2050 roadmap calls for global solar capacity to reach 14,000 GW by 2050—a 10-fold increase from current levels. Traditional generation will not disappear overnight; natural gas will remain necessary for winter peaks and industrial processes. But the direction of travel is unambiguous.
The remaining questions are not about whether solar will dominate new generation—that is settled economics. The questions are about grid architecture, market design, and the speed of regulatory reform. For system operators, the priority is integrating solar technology with storage and demand response. For policymakers, the priority is accelerating interconnection and permitting. For consumers, the priority is simple: solar is now the lowest-cost electricity option in most of the world, and the gap is widening every year.
The data is clear. The economics are decisive. The transition is underway.
Latest from DLXN Energy